Quality control, heritability analyses, and updates to summary statistics
We are excited to report significant updates to our summary statistics and data release:
- We performed heritability analyses across > 16,000 ancestry-trait pairs using several approaches.
- We developed a detailed summary statistics QC approach to prioritize the highest-quality phenotypes best suited for downstream analyses.
- We identified a maximally independent set of phenotypes that passed our QC filters.
- We recomputed summary statistics for traits that showed extremely significant p-values with standard errors of 0, now with non-zero standard errors and -values to avoid numerical underflow.
- We updated cross-ancestry meta-analyses to incorporate updated summary statistics and also computed new meta-analyses using only QC-pass ancestry-trait pairs.
How to use QC-ed sumstats#
If using the UKBB Pan Ancestry codebase, the final summary statistics MatrixTable filtered to the phenotype-ancestry pairs passing all QC can be obtained via:
If using the manifest flat file directly (available here), filter on phenotype_qc_{ancestry} == PASS for the ancestry of interest.
Heritability analyses#
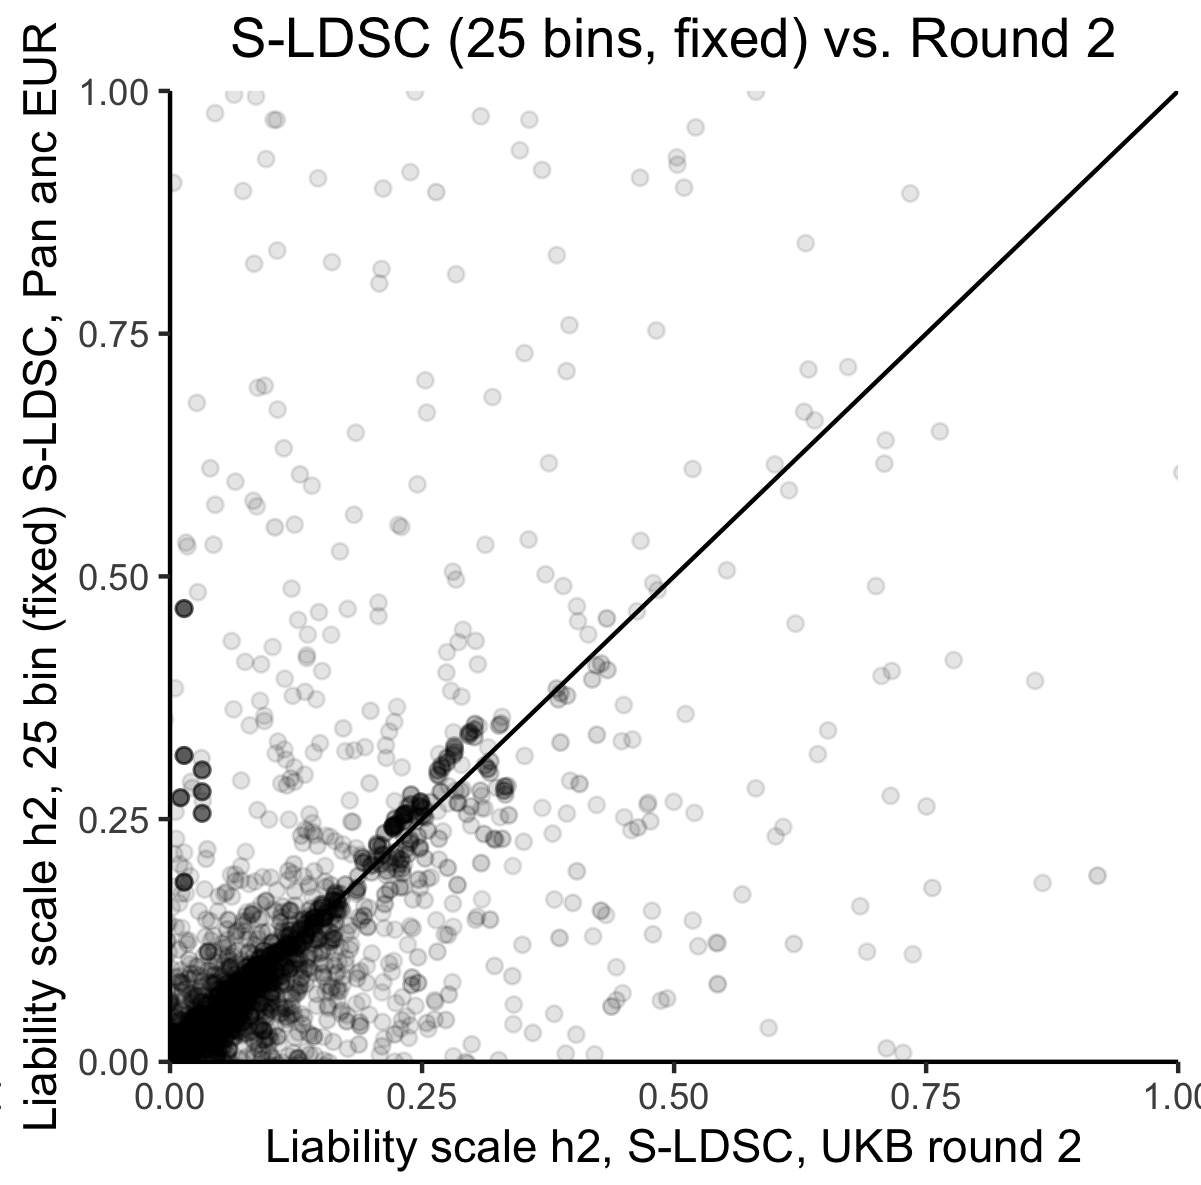
We produced narrow-sense heritability estimates using univariate linkage-disequilibrium score regression (LDSC) leveraging LD scores computed as previously described, as well as using stratified LDSC with 25 minor allele frequency (MAF) and LD score bins. Our results for summary statistics for individuals of EUR ancestry were highly concordant with prior estimates in UKB for overlapping phenotypes (Figure 1), however we observed very poor power for detection of for non-EUR ancestry groups.

Figure 1: Comparison of liability-scale estimates for EUR ancestry-trait pairs using S-LDSC (25 bins) in UKB versus prior estimates using S-LDSC with the baselineLDv1.1 model in UKB among EUR samples. Black line is .
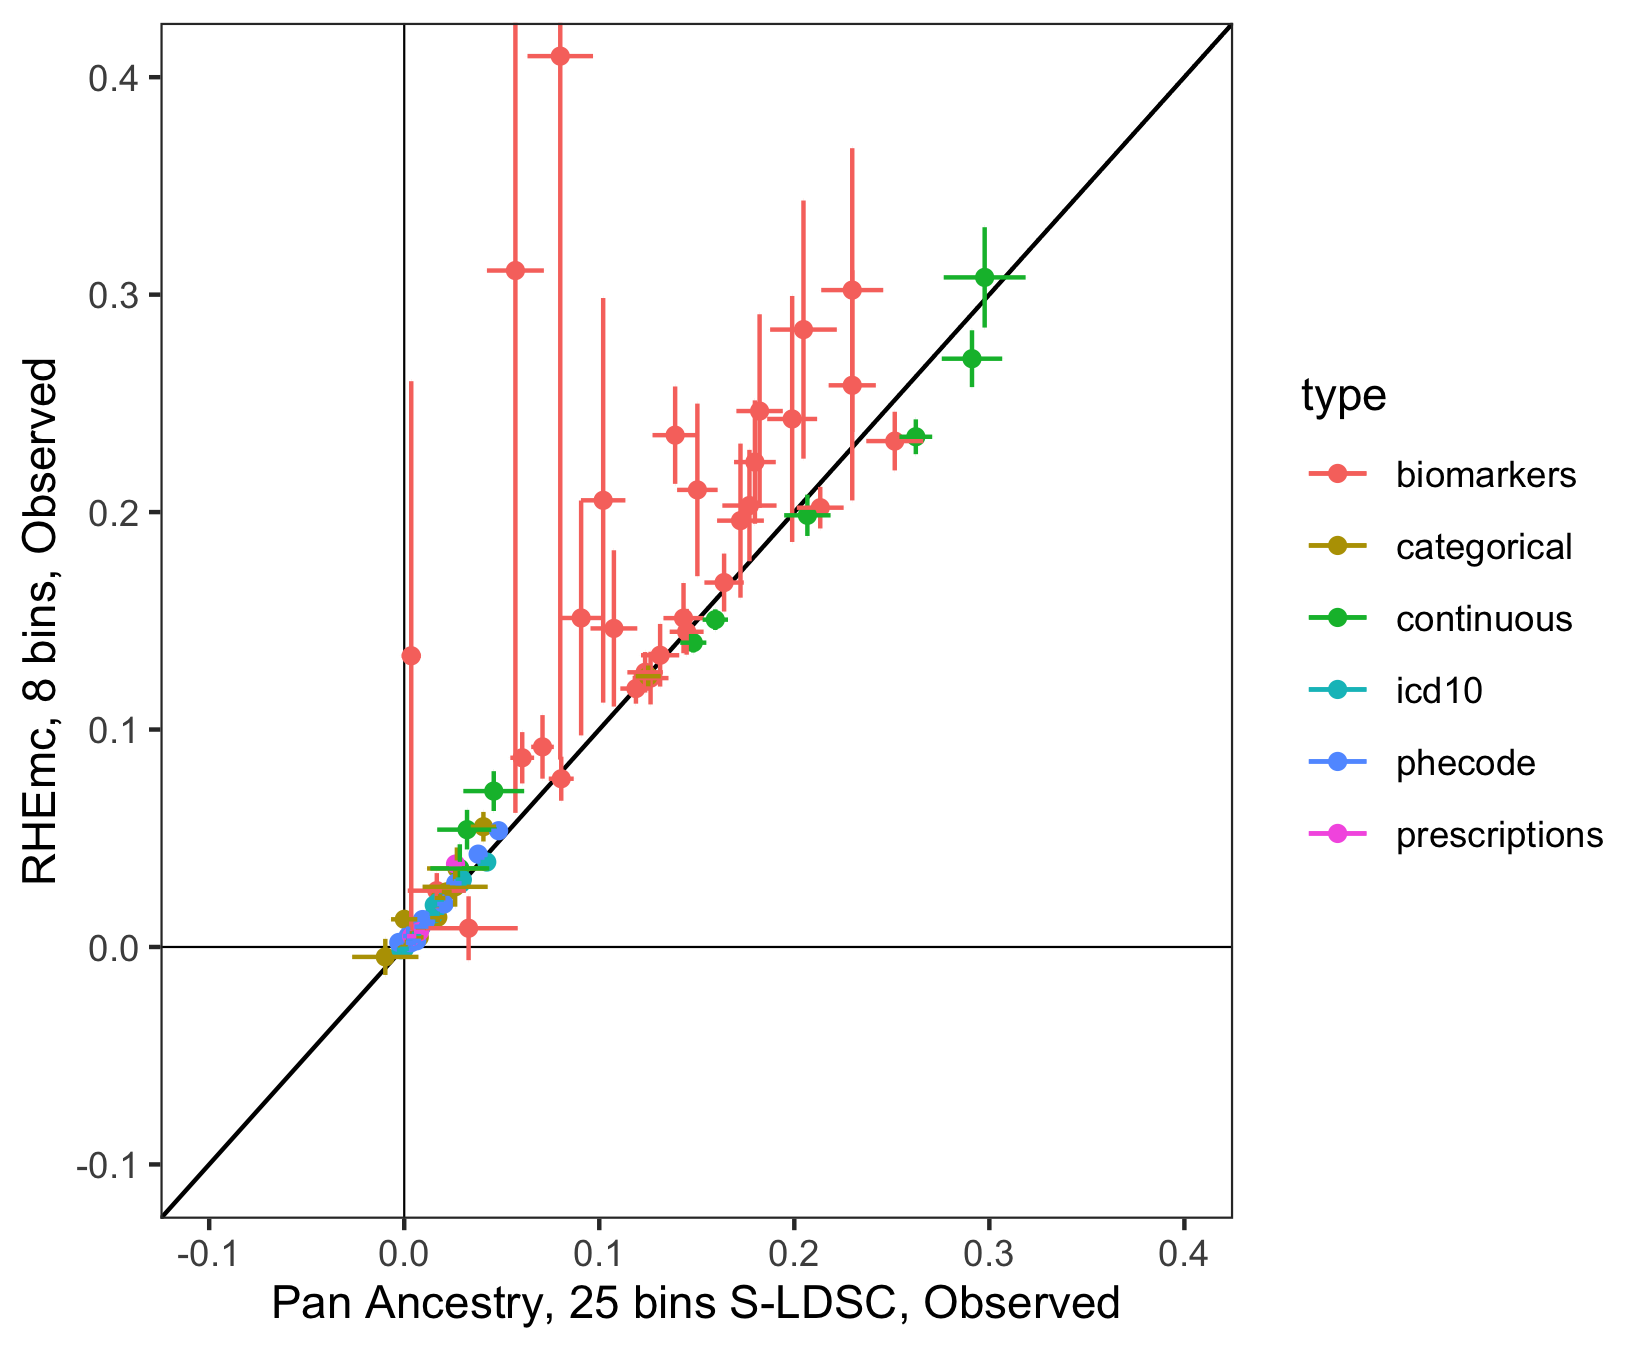
To boost power for non-EUR ancestry groups we leveraged Haseman-Elston regression at scale on genotypes implemented in RHEmc (Pazokitoroudi et al. 2020 Nat Comm). We piloted this approach for several pilot phenotypes expected to behave well, finding good correlations between estimates in EUR using RHEmc and S-LDSC (Figure 2).

Figure 2: Observed-scale estimates in select phenotypes among EUR individuals obtained using RHEmc (8 bins, to limit computational cost) vs. using S-LDSC (25 bins), colored by trait type category. Black line is .
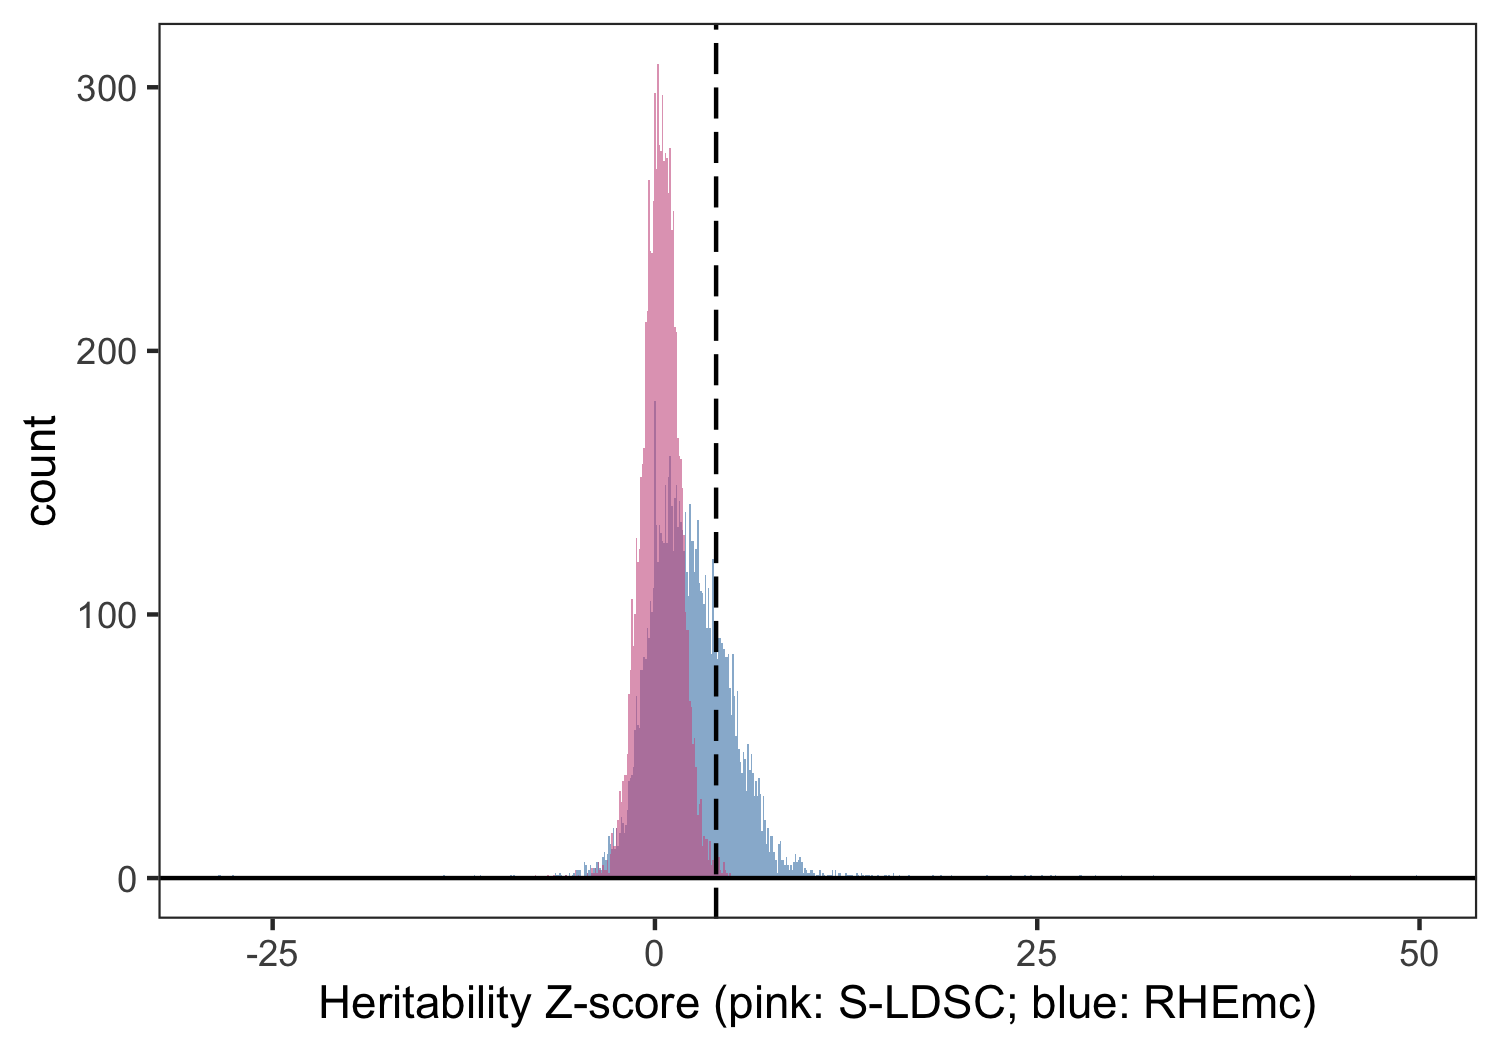
We then extended this approach to all non-EUR ancestry-trait pairs and report these results using both 8 and 25 MAF-LD score bins. We observe an increase in power for detecting non-zero using this method for non-EUR individuals relative to S-LDSC (Figure 3) as expected from genotype-based approaches. Due to computational cost and the similarity of estimates observed for EUR individuals between S-LDSC and RHEmc, our final estimates use S-LDSC for EUR and RHEmc for non-EUR ancestry groups.

Figure 3: Distribution of z-scores for non-EUR ancestry-trait pairs in UKB when computed using summary statistics (S-LDSC, pink) or genotype data (RHEmc, blue). Dotted line corresponds to .
We have made our final heritability estimates available for download in the phenotype manifest and data from all methods available in the heritability manifest. All results are also available in MatrixTable format. Further description of the heritability estimation approach can be found here.
QC approach#
We observed significantly negative RHEmc heritability estimates for traits that were likely to have a high propensity of confounding (e.g., UK geographic location). We subsequently developed a systematic QC approach using the following sequential filters to prioritize high quality phenotypes for further analysis:
GWAS_run: if the GWAS was performed for the ancestry-trait pairancestry_reasonable_n: if the ancestry has a reasonable sample size; has the effect of removing AMRdefined_h2: if the heritability estimate is non-missingsignificant_z: if the ancestry-trait pair shows z-scorein_bounds_h2: if, for all ancestries for a given trait, observed-scale heritability estimatesnormal_lambda: if, for all ancestries for a given trait,normal_ratio: if, for the top three best powered ancestry groups (EUR, CSA, AFR), the S-LDSC ratio, given by , or the ratio z-scoreEUR_plus_1: if the trait passes all above filters in EUR and at least 1 other ancestry group
A more detailed description of the approach is forthcoming. All QC results for ancestry-trait pairs can be found in the phenotype manifest and heritability manifest.
Maximally independent set#
Using the set of phenotypes with ancestries passing all of the above QC filters, we next wanted to construct a set of independent phenotypes to avoid double-counting in downstream analyses. To this end we constructed a maximally independent set of phenotypes using a pairwise phenotypic correlation matrix (released here via make_pairwise_ht). Of all phenotype pairs, we retained any with a pairwise correlation . For phenotype pairs with , we used hl.maximal_independent_set to identify indendent phenotypes for retention, imposing a tiebreaker of higher case count (or higher sample size for continuous phenotypes). This resulted in the selection of 195 independent phenotypes, which were used in subsequent analyses analyzing trends across phenotypes. We have released this set in the phenotype manifest.
Updated summary statistics and meta analyses#
Using the updated summary statistics (now with -values), we reproduced cross-ancestry meta-analyses for all phenotypes (using only ancestry groups for which GWAS was completed). These are represented in the corresponding phenotype-specific summary statistics as columns with the _meta suffix.
We also produced a new set of "high quality" meta-analyses which only include ancestries passing QC (see QC approach). These meta-analyses are only available for phenotypes for which QC-passing ancestry groups exist. These new "high quality" meta-analysis results are present in columns with the _meta_hq suffix in the corresponding summary statistics for phenotypes for which they were computed.
We have updated our codebase to export these updated manifests and summary statistics, which have now been uploaded to AWS. See the summary statistics key for information on the summary statistics columns containing these meta-analyses as well as other new fields.
Please note that the previous iteration of release files have been archived at s3://pan-ukb-us-east-1/archive_20200615/.