LD score comparisons between gnomAD and UK Biobank
In this analysis, we aimed to better understand the similarities and differences between imputation-based and sequence-based LD scores. To this end, we compared LD scores from gnomAD (sequence-based) and UKB (imputation-based) across four ancestry groups: African (AFR), Admixed American (AMR), East Asian (EAS), and North-Western European (EUR; NWE in gnomAD). This also serves as a more general comparison between LD scores from two separate cohorts. LD scores were obtained as follows.
UKB LD scores#
LD scores in UKB were computed within each ancestry group. The genotype matrix was standardized, and variants were filtered to (the same variant-level filter as used for the Pan UKBB GWAS). For covariate correction, the residuals from the regression of were obtained via where , the residual-maker matrix, and is the matrix of covariates. The covariates used for adjustment were the same covariates used for the Pan-UKB GWAS, namely , , , , , and the first 10 PCs of the genotype matrix (more information about covariate selection can be found at the Pan UKBB website). The LD matrix was produced via with a window size of . A bias adjustment for was performed by . LD scores were subsequently computed using with a radius of .
gnomAD LD scores#
LD scores were previously computed from individuals in the gnomAD cohort within each ancestry. After filtering variants to and standardizing the genotype matrix , the LD matrix was constructed via with a radius of . A bias adjustment for was performed by . LD scores were subsequently computed using with variants with and sufficiently high call rate () with a radius of .
Comparisons#
LD scores were compared from individuals in the gnomAD cohort from ancestries that were also analyzed in UKB, namely individuals with African (AFR), Admixed American (AMR), East Asian (EAS), and non-Finnish European (EUR; NFE in gnomAD) ancestry. We restricted our comparisons to HapMap3 SNPs.
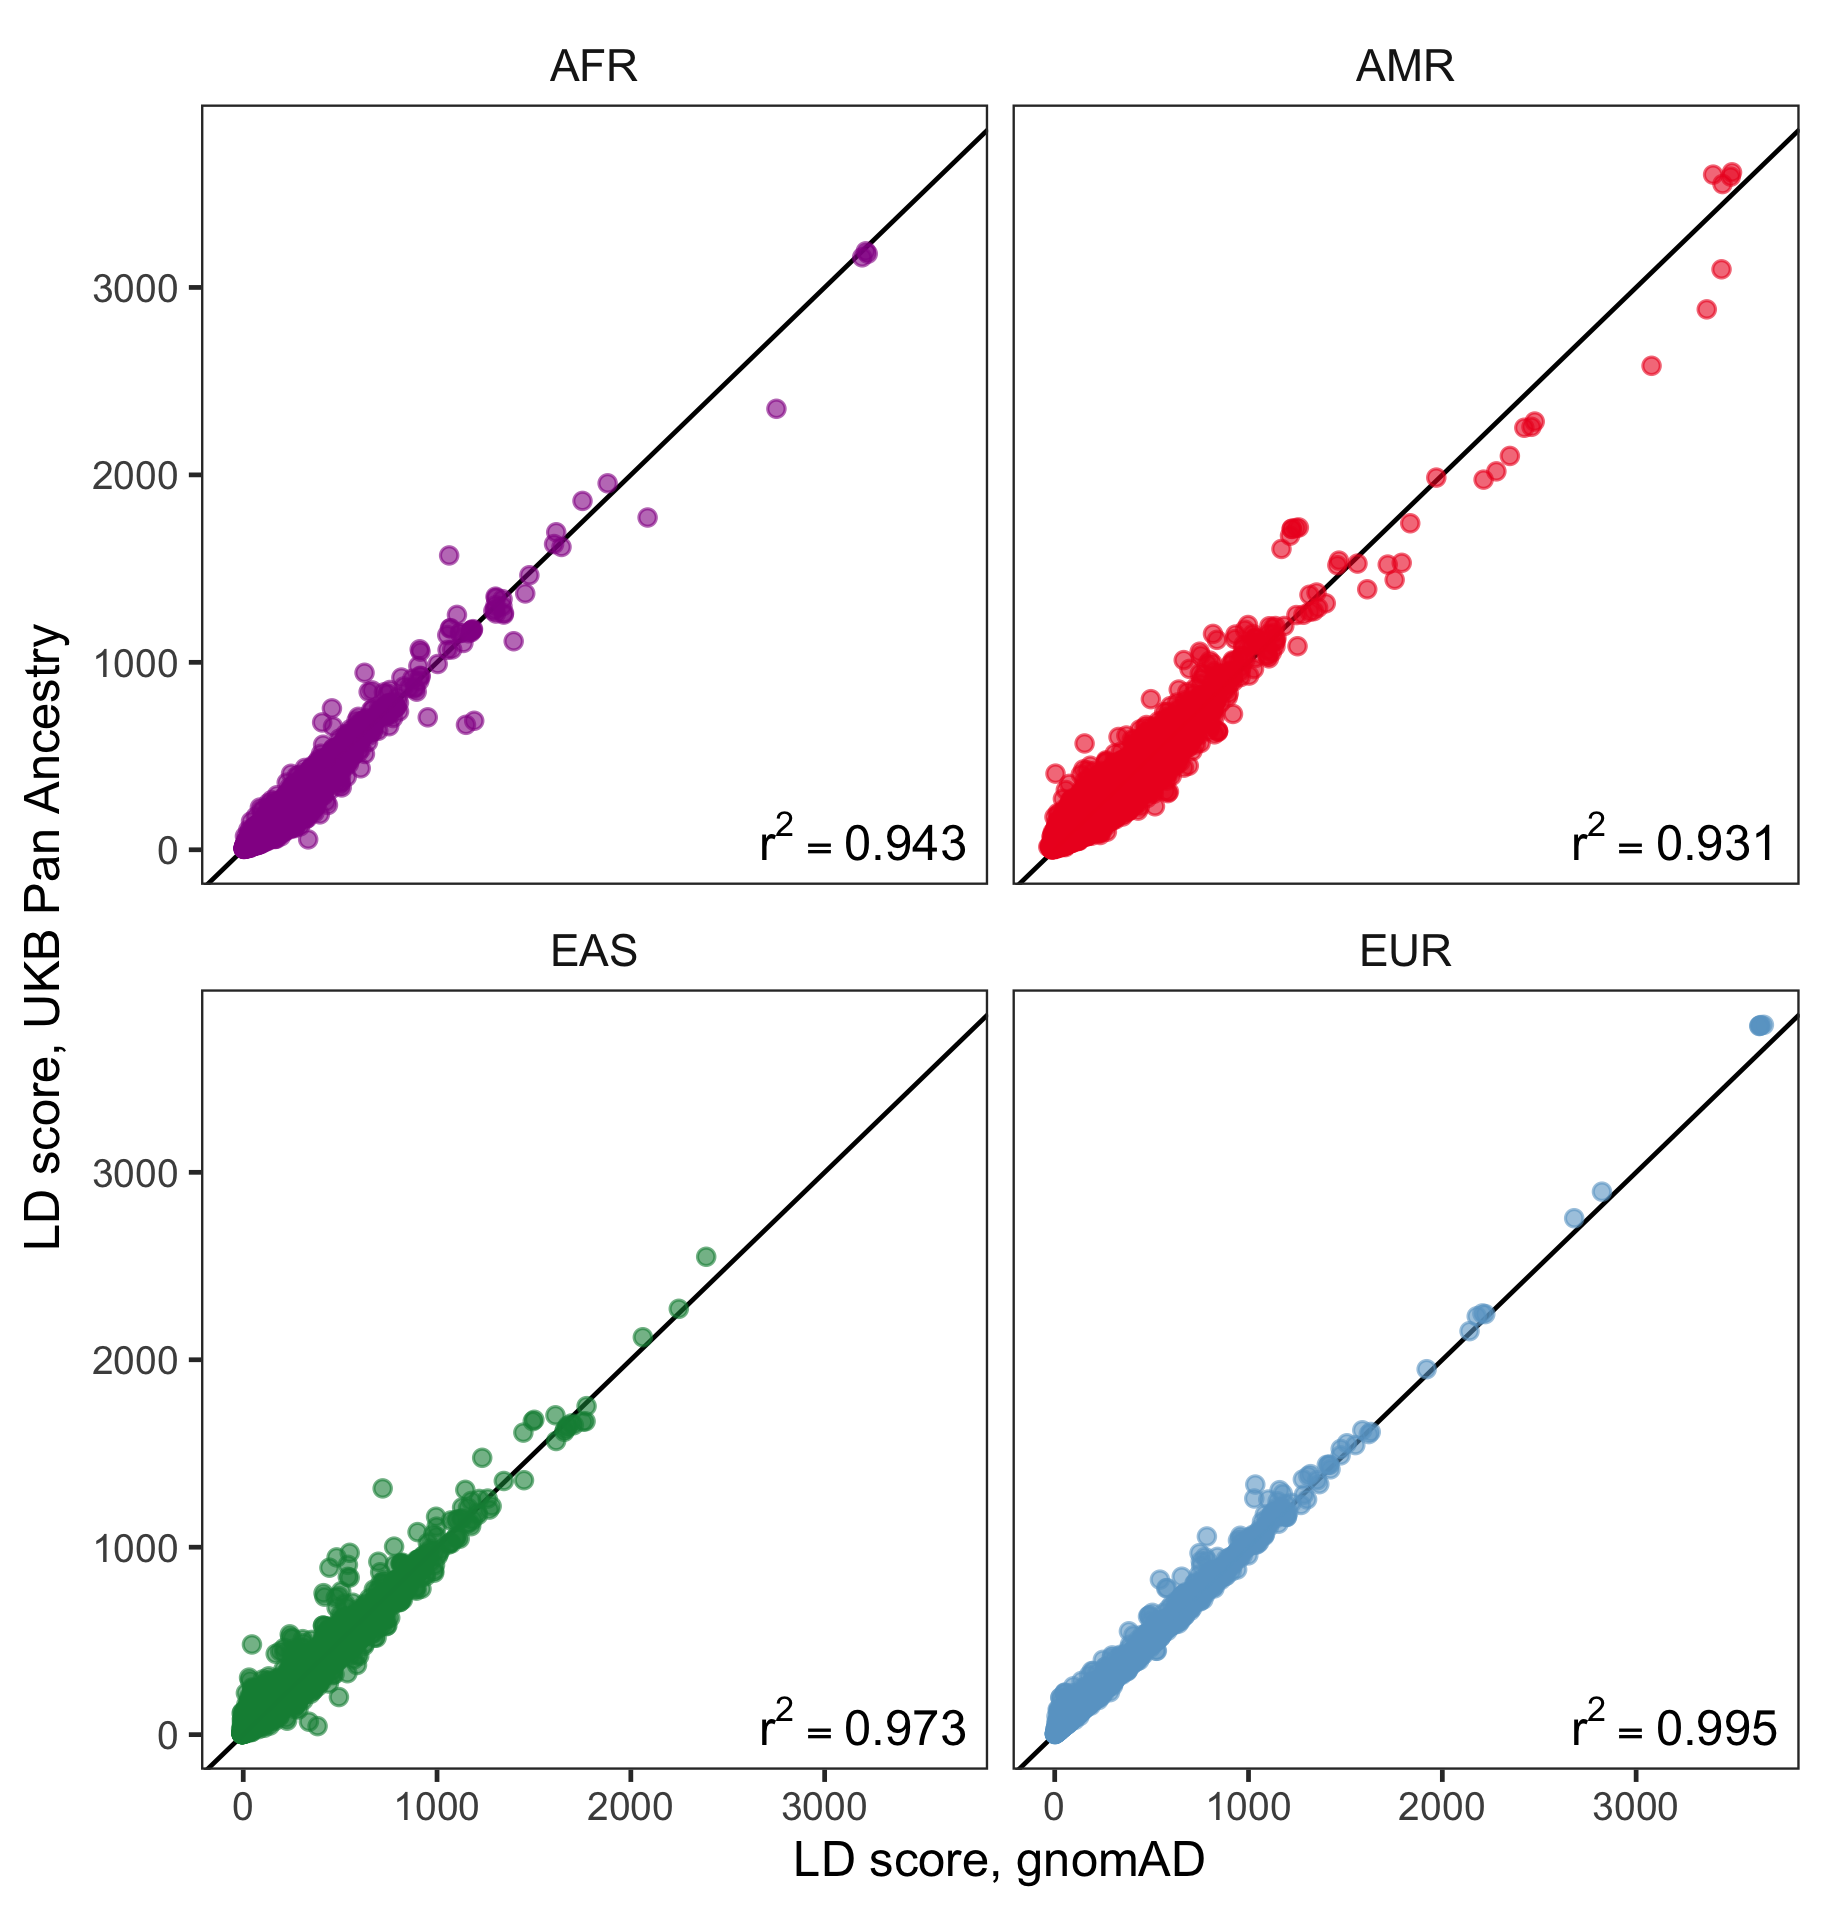
Figure 1: Pairwise comparisons of LD scores in UKB vs. gnomAD within ancestries. Red line is the line. SNPs were subsampled randomly prior to plotting to improve readability.
For these four populations, we find very strong concordance of LD scores when comparing gnomAD and UKB (Figure 1). values were consistently above , with highest values observed for EUR and EAS. Correlation values for AMR and AFR were slightly lower. We suspect that differences may be due to (1) the higher degree of genetic diversity in these populations and (2) systematic differences in these populations between the gnomAD and UKB cohorts.